This guide shows how to build a React crypto candlestick chart with react-candlesticks, using public OHLCV/kline data from Binance. The example fetches crypto candles for pairs such as BTCUSDT and ETHUSDT, maps them into chart data, then renders candlesticks, volume bars, and optional indicators using React components.
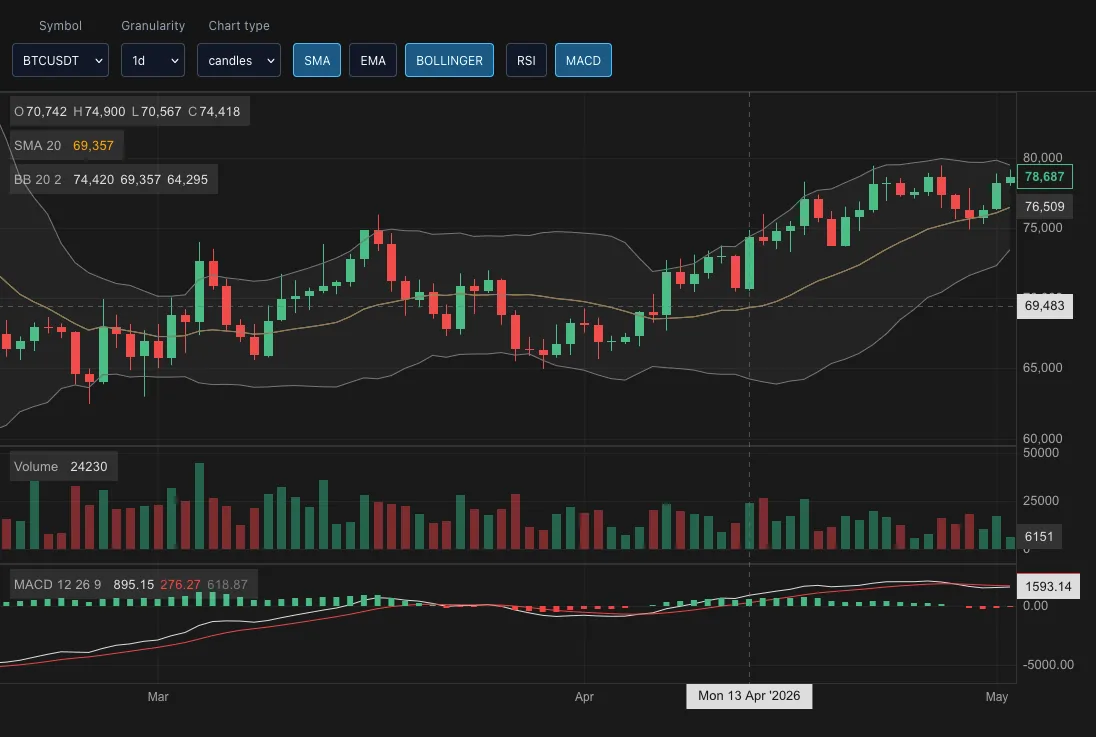
You can also try the live StackBlitz demo, view the GitHub example project, or browse more examples in the React Candlesticks docs.
What you will build
In this tutorial, you will create a React crypto chart with:
- BTC, ETH, SOL, and BNB symbol selection
- 15 minute, 1 hour, 4 hour, and 1 day candles
- Candlestick, OHLC bar, and area chart modes
- Volume bars synchronized with the price chart
- SMA, EMA, and Bollinger Bands overlays
- RSI and MACD indicator panels
- Binance kline data mapped into a React chart data model
The result is a small crypto charting interface that you can build on for a more complete trading or market analysis app.
Install React Candlesticks
Install the package:
npm install react-candlesticksThe full source is available in the GitHub example project.
Import the stylesheet once in your app:
import 'react-candlesticks/style.css';The chart is built with React components, so the main chart layout is expressed in JSX:
<Chart data={data} granularity="h1" theme="dark">
  <Panel heightRatio={3}>
    <Candlesticks />
    <SMA period={20} />
    <BollingerBands />
  </Panel>

  <Panel>
    <VolumeBars />
  </Panel>

  <Panel>
    <RSI />
  </Panel>
</Chart>
That composition model is useful when you want to build custom trading UIs in React rather than embed a fixed chart widget.
Fetch crypto candles from Binance
Binance calls candlestick data klines. Each kline contains open time, open, high, low, close, volume, and other fields.
For a React crypto candlestick chart, the important values are:
- time
- open
- high
- low
- close
- volume
react-candlesticks expects those values in a DataPoint shape. The example below converts Binance kline rows into chart data.
import type { ChartProps, DataPoint } from 'react-candlesticks';

type BinanceInterval = '15m' | '1h' | '4h' | '1d';
type Granularity = NonNullable<ChartProps['granularity']>;

const INTERVAL_TO_GRANULARITY: Record<BinanceInterval, Granularity> = {
  '15m': 'm15',
  '1h': 'h1',
  '4h': 'h4',
  '1d': 'd1',
};

type BinanceKline = [
  number, // open time
  string, // open
  string, // high
  string, // low
  string, // close
  string, // volume
  number, // close time
  string, // quote asset volume
  number, // number of trades
  string, // taker buy base asset volume
  string, // taker buy quote asset volume
  string, // unused
];

function toDataPoint(kline: BinanceKline): DataPoint {
  return {
    time: new Date(kline[0]).toISOString(),
    open: Number(kline[1]),
    high: Number(kline[2]),
    low: Number(kline[3]),
    close: Number(kline[4]),
    volume: Number(kline[5]),
  };
}

async function fetchCryptoCandles(
  symbol: string,
  interval: BinanceInterval,
  signal?: AbortSignal,
) {
  const params = new URLSearchParams({
    symbol,
    interval,
    limit: '300',
  });

  const response = await fetch(
    `https://api.binance.com/api/v3/klines?${params}`,
    { signal },
  );

  if (!response.ok) {
    throw new Error(`Binance request failed: ${response.status}`);
  }

  const rows = (await response.json()) as BinanceKline[];
  return rows.map(toDataPoint);
}
For production applications, you may want to route market data through your own API. That lets you cache popular symbol and interval combinations, handle provider failures, normalize data from multiple sources, and keep provider-specific logic away from your UI components.
Build the React crypto chart component
The main component owns the selected symbol, interval, chart type, and indicator state.
When the user changes the symbol or interval, the component fetches a new set of OHLCV candles and redraws the chart.
import 'react-candlesticks/style.css';
import './App.css';

import { useEffect, useMemo, useState } from 'react';
import type { ChartProps, DataPoint } from 'react-candlesticks';
import {
  Area,
  BollingerBands,
  Candlesticks,
  Chart,
  EMA,
  MACD,
  OhlcBars,
  Panel,
  RSI,
  SMA,
  VolumeBars,
} from 'react-candlesticks';

type BinanceInterval = '15m' | '1h' | '4h' | '1d';
type ChartType = 'candles' | 'ohlc' | 'area';
type OverlayIndicator = 'sma' | 'ema' | 'bollinger';
type PanelIndicator = 'rsi' | 'macd';
type Granularity = NonNullable<ChartProps['granularity']>;

const SYMBOLS = ['BTCUSDT', 'ETHUSDT', 'SOLUSDT', 'BNBUSDT'] as const;
const INTERVALS: BinanceInterval[] = ['15m', '1h', '4h', '1d'];
const CHART_TYPES: ChartType[] = ['candles', 'ohlc', 'area'];

const OVERLAY_INDICATORS: OverlayIndicator[] = ['sma', 'ema', 'bollinger'];
const PANEL_INDICATORS: PanelIndicator[] = ['rsi', 'macd'];

const INTERVAL_TO_GRANULARITY: Record<BinanceInterval, Granularity> = {
  '15m': 'm15',
  '1h': 'h1',
  '4h': 'h4',
  '1d': 'd1',
};

type BinanceKline = [
  number,
  string,
  string,
  string,
  string,
  string,
  number,
  string,
  number,
  string,
  string,
  string,
];

function toDataPoint(kline: BinanceKline): DataPoint {
  return {
    time: new Date(kline[0]).toISOString(),
    open: Number(kline[1]),
    high: Number(kline[2]),
    low: Number(kline[3]),
    close: Number(kline[4]),
    volume: Number(kline[5]),
  };
}

async function fetchCryptoCandles(
  symbol: string,
  interval: BinanceInterval,
  signal?: AbortSignal,
) {
  const params = new URLSearchParams({
    symbol,
    interval,
    limit: '300',
  });

  const response = await fetch(
    `https://api.binance.com/api/v3/klines?${params}`,
    { signal },
  );

  if (!response.ok) {
    throw new Error(`Binance request failed: ${response.status}`);
  }

  const rows = (await response.json()) as BinanceKline[];
  return rows.map(toDataPoint);
}

export default function App() {
  const [symbol, setSymbol] = useState<(typeof SYMBOLS)[number]>('BTCUSDT');
  const [interval, setInterval] = useState<BinanceInterval>('1h');
  const [chartType, setChartType] = useState<ChartType>('candles');

  const [overlays, setOverlays] = useState<Record<OverlayIndicator, boolean>>({
    sma: true,
    ema: false,
    bollinger: true,
  });

  const [panels, setPanels] = useState<Record<PanelIndicator, boolean>>({
    rsi: false,
    macd: true,
  });

  const [data, setData] = useState<DataPoint[]>([]);
  const [status, setStatus] = useState('Loading candles...');

  useEffect(() => {
    const controller = new AbortController();

    setStatus('Loading candles...');

    fetchCryptoCandles(symbol, interval, controller.signal)
      .then((candles) => {
        setData(candles);
        setStatus('');
      })
      .catch((error: unknown) => {
        if (error instanceof DOMException && error.name === 'AbortError') {
          return;
        }

        setStatus('Unable to load crypto data. Try another interval or symbol.');
      });

    return () => controller.abort();
  }, [symbol, interval]);

  const granularity = INTERVAL_TO_GRANULARITY[interval];

  const hasPanelIndicator = useMemo(
    () => Object.values(panels).some(Boolean),
    [panels],
  );

  const toggleOverlay = (indicator: OverlayIndicator) => {
    setOverlays((current) => ({
      ...current,
      [indicator]: !current[indicator],
    }));
  };

  const togglePanel = (indicator: PanelIndicator) => {
    setPanels((current) => ({
      ...current,
      [indicator]: !current[indicator],
    }));
  };

  return (
    <main className="crypto-dashboard">
      <div className="toolbar" aria-label="Crypto chart controls">
        <label>
          Symbol
          <select
            value={symbol}
            onChange={(event) => {
              setSymbol(event.target.value as typeof symbol);
            }}
          >
            {SYMBOLS.map((item) => (
              <option key={item} value={item}>
                {item}
              </option>
            ))}
          </select>
        </label>

        <label>
          Granularity
          <select
            value={interval}
            onChange={(event) => {
              setInterval(event.target.value as BinanceInterval);
            }}
          >
            {INTERVALS.map((item) => (
              <option key={item} value={item}>
                {item}
              </option>
            ))}
          </select>
        </label>

        <label>
          Chart type
          <select
            value={chartType}
            onChange={(event) => {
              setChartType(event.target.value as ChartType);
            }}
          >
            {CHART_TYPES.map((item) => (
              <option key={item} value={item}>
                {item}
              </option>
            ))}
          </select>
        </label>

        <div className="toggle-group" aria-label="Overlay indicators">
          {OVERLAY_INDICATORS.map((indicator) => (
            <button
              key={indicator}
              type="button"
              className={overlays[indicator] ? 'is-active' : ''}
              onClick={() => toggleOverlay(indicator)}
            >
              {indicator}
            </button>
          ))}
        </div>

        <div className="toggle-group" aria-label="Panel indicators">
          {PANEL_INDICATORS.map((indicator) => (
            <button
              key={indicator}
              type="button"
              className={panels[indicator] ? 'is-active' : ''}
              onClick={() => togglePanel(indicator)}
            >
              {indicator}
            </button>
          ))}
        </div>
      </div>

      <section
        className="chart-wrap"
        aria-label={`${symbol} ${interval} React crypto candlestick chart`}
      >
        {status ? <p className="chart-status">{status}</p> : null}

        {data.length > 0 ? (
          <Chart
            data={data}
            granularity={granularity}
            theme="dark"
            initialScrollToLatest
          >
            <Panel heightRatio={3}>
              {chartType === 'candles' ? <Candlesticks /> : null}
              {chartType === 'ohlc' ? <OhlcBars /> : null}
              {chartType === 'area' ? <Area /> : null}

              {overlays.sma ? <SMA period={20} /> : null}
              {overlays.ema ? <EMA period={50} /> : null}
              {overlays.bollinger ? <BollingerBands /> : null}
            </Panel>

            <Panel>
              <VolumeBars />
            </Panel>

            {hasPanelIndicator && panels.rsi ? (
              <Panel>
                <RSI />
              </Panel>
            ) : null}

            {hasPanelIndicator && panels.macd ? (
              <Panel>
                <MACD />
              </Panel>
            ) : null}
          </Chart>
        ) : null}
      </section>
    </main>
  );
}
The price panel changes layer based on chartType. Overlay indicators stay in the main price panel, while RSI and MACD render as separate panels below volume. That keeps the chart layout clear and makes it easier to add more indicators later.
Add the page styles
The chart needs a parent element with a real height. The rest of the CSS keeps the controls compact and gives active indicators a clear selected state.
html,
body,
#root {
  width: 100%;
  height: 100%;
  margin: 0;
}

.crypto-dashboard {
  display: grid;
  grid-template-rows: auto minmax(0, 1fr);
  min-height: 100vh;
  background: #151515;
  color: #e5e7eb;
}

.toolbar {
  display: flex;
  flex-wrap: wrap;
  gap: 12px;
  align-items: end;
  padding: 14px;
  border-bottom: 1px solid rgb(148 163 184 / 24%);
  font-size: 12px;
}

.toolbar label {
  display: grid;
  gap: 5px;
  color: #94a3b8;
  font-size: 12px;
}

.toolbar select,
.toggle-group button {
  min-height: 34px;
  border: 1px solid rgb(148 163 184 / 35%);
  border-radius: 4px;
  background: #111827;
  color: #f8fafc;
  font: inherit;
}

.toolbar select {
  padding: 0 10px;
}

.toggle-group {
  display: flex;
  flex-wrap: wrap;
  gap: 8px;
}

.toggle-group button {
  padding: 0 10px;
  text-transform: uppercase;
}

.toggle-group button.is-active {
  border-color: #38bdf8;
  background: #075985;
}

.chart-wrap {
  position: relative;
  min-height: 0;
}

.chart-status {
  position: absolute;
  inset: 16px auto auto 16px;
  z-index: 1;
  margin: 0;
  color: #cbd5e1;
}
Why map Binance intervals to chart granularity?
The data provider and the chart library use different names for the same idea.
Binance intervals use values such as:
'15m' | '1h' | '4h' | '1d'react-candlesticks granularities use values such as:
'm15' | 'h1' | 'h4' | 'd1'Keeping that mapping explicit makes the chart easier to maintain. If you later add 5 minute candles, weekly candles, or a different data provider, you only need to update one small mapping rather than spread provider-specific values throughout your React components.
Why use panels for volume and indicators?
A crypto trading chart often combines several different types of data. Price candles, volume, overlays, and oscillator indicators are easier to read when they are not all forced onto one scale.
Some layers belong on the price scale. For example, SMA, EMA, and Bollinger Bands are plotted against price, so they work well as overlays in the main price panel.
Other indicators need their own vertical scale. RSI and MACD are easier to read in separate panels because they do not share the same units as price.
The example uses this split:
<Chart data={data} granularity={granularity} theme="dark">
  <Panel heightRatio={3}>
    <Candlesticks />
    <SMA period={20} />
    <BollingerBands />
  </Panel>

  <Panel>
    <VolumeBars />
  </Panel>

  <Panel>
    <RSI />
  </Panel>

  <Panel>
    <MACD />
  </Panel>
</Chart>
This keeps the chart declarative: the JSX describes the chart structure, and React state controls which layers are rendered.
Why use React Candlesticks for a crypto chart?
react-candlesticks is designed for React trading interfaces where the chart is part of a wider application.
The chart is composed from React components, while rendering is handled with Canvas for performance. That means you can build the surrounding app with normal React state, props, routing, and UI components, while still rendering large financial datasets efficiently.
For a simple hosted widget, a full charting platform may be enough. For a custom React trading UI, a component-based chart API can be easier to integrate and extend.
Production notes for crypto market data
The Binance endpoint is convenient for a tutorial because it returns OHLCV candles directly. Real applications usually need a few extra pieces around the request.
For production, consider:
- caching popular symbol and interval combinations
- handling provider rate limits
- retrying temporary failures
- normalizing data if you support more than one provider
- validating response data before rendering
- using your own API layer instead of calling the provider directly from the browser
- using a WebSocket stream if you need live candle updates after the initial REST load
For a basic historical crypto price chart, a REST request is often enough. For live trading dashboards, you will usually want an initial candle load followed by streaming updates.
Next steps
You now have a React crypto price chart that loads OHLCV data, changes symbol, changes interval, switches chart type, and renders volume and technical indicators.
From here, you could add:
- live candle updates with a WebSocket stream
- a watchlist beside the chart
- saved chart preferences
- custom themes
- alert lines
- drawings
- more indicators
- comparison views for multiple crypto pairs
Try the live demo, view the GitHub example project, follow the getting started guide, browse more examples, or read the candlestick chart with volume and indicators tutorial.
npm install react-candlesticksFAQ
Does this work with Next.js?
Yes. For Next.js apps, make sure the chart is rendered as a client component because it uses browser rendering. You can read the separate Next.js candlestick chart guide for a focused example.
Is this only for Binance data?
No. Binance is used here because the public kline endpoint is convenient for a tutorial. You can use any provider if you map its data into the DataPoint shape with time, open, high, low, close, and optionally volume.
Can I use this for stocks as well as crypto?
Yes. The chart components are not crypto-specific. They can be used for stocks, ETFs, futures, forex, or other OHLCV datasets if you provide the appropriate data.