This guide shows how to use react-candlesticks in a Next.js project. You will build an interactive candlestick chart with a price header, volume panel, SMA 20 and SMA 50 overlays, and a Stochastic indicator panel.
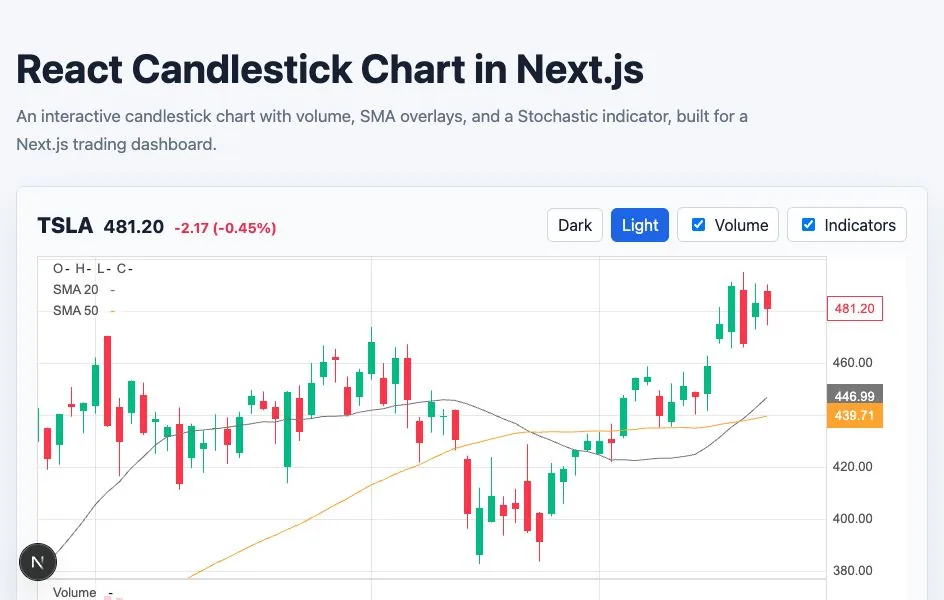
You can try the live CodeSandbox demo, browse the GitHub example, run it locally, or copy the files below into a Next.js app.
What you will build
The example keeps the page structure small and puts the trading UI into one chart component.
- A React candlestick chart in Next.js
- A compact symbol, price, and change header
- Light and dark theme controls
- Toggleable volume and indicator panels
- SMA 20 and SMA 50 overlays
- A Stochastic oscillator panel
Install dependencies
npm install next@15 react react-dom react-candlesticksImport the chart stylesheet
Import the package stylesheet from the root layout so it is available wherever the chart renders.
import 'react-candlesticks/style.css';
import './globals.css';

export default function RootLayout({
  children,
}: Readonly<{
  children: React.ReactNode;
}>) {
  return (
    <html lang="en">
      <body>{children}</body>
    </html>
  );
}
Keep the page server-rendered
The page imports a client loader, but the page itself does not need 'use client'. It can stay focused on the surrounding layout while the chart component owns chart state and browser rendering.
import ChartLoader from './components/ChartLoader';

export default function Home() {
  return (
    <main className="page-shell">
      <section className="intro">
        <h1>React Candlestick Chart in Next.js</h1>
        <p>
          An interactive candlestick chart with volume, SMA overlays, and a
          Stochastic indicator, built for a Next.js trading dashboard.
        </p>
      </section>

      <section className="dashboard" aria-label="Trading chart">
        <ChartLoader />
      </section>
    </main>
  );
}
Load the chart only in the browser
Create a small Client Component that uses next/dynamic. The ssr: false option tells Next.js not to prerender the chart component on the server.
'use client';

import dynamic from 'next/dynamic';

const CandlestickChart = dynamic(() => import('./CandlestickChart'), {
  ssr: false,
  loading: () => <div className="chart-loading">Loading chart...</div>,
});

export default function ChartLoader() {
  return <CandlestickChart />;
}
Render the candlestick chart
The actual chart component is also a Client Component. It can use React state for controls and render react-candlesticks layers normally.
'use client';

import { useState } from 'react';
import {
  Candlesticks,
  Chart,
  Panel,
  SMA,
  Stochastic,
  VolumeBars,
  exampleData,
} from 'react-candlesticks';

type ChartTheme = 'light' | 'dark';

export default function CandlestickChart() {
  const [theme, setTheme] = useState<ChartTheme>('light');
  const [showVolume, setShowVolume] = useState(true);
  const [showIndicators, setShowIndicators] = useState(true);

  const latest = exampleData[exampleData.length - 1];
  const previous = exampleData[exampleData.length - 2];
  const change = latest.close - previous.close;
  const changePercent = (change / previous.close) * 100;

  return (
    <div className={`chart-card chart-card--${theme}`}>
      <div className="chart-toolbar">
        <div className="chart-quote">
          <span className="chart-symbol">TSLA</span>
          <span className="chart-price">{latest.close.toFixed(2)}</span>
          <span className={change >= 0 ? 'change change--up' : 'change change--down'}>
            {change >= 0 ? '+' : ''}
            {change.toFixed(2)} ({changePercent.toFixed(2)}%)
          </span>
        </div>
        <div className="chart-actions" aria-label="Chart controls">
          <button
            type="button"
            className={theme === 'dark' ? 'is-active' : ''}
            onClick={() => setTheme('dark')}
          >
            Dark
          </button>
          <button
            type="button"
            className={theme === 'light' ? 'is-active' : ''}
            onClick={() => setTheme('light')}
          >
            Light
          </button>
          <label>
            <input
              type="checkbox"
              checked={showVolume}
              onChange={(event) => setShowVolume(event.target.checked)}
            />
            Volume
          </label>
          <label>
            <input
              type="checkbox"
              checked={showIndicators}
              onChange={(event) => setShowIndicators(event.target.checked)}
            />
            Indicators
          </label>
        </div>
      </div>

      <div className="chart-frame">
        <Chart
          data={exampleData}
          granularity="d1"
          initialScrollToLatest
          theme={theme}
        >
          <Panel heightRatio={3}>
            <Candlesticks />
            {showIndicators ? (
              <SMA period={20} series={{ value: { color: '#777' } }} />
            ) : null}
            {showIndicators ? <SMA period={50} /> : null}
          </Panel>
          {showVolume ? (
            <Panel>
              <VolumeBars />
            </Panel>
          ) : null}
          {showIndicators ? (
            <Panel>
              <Stochastic />
            </Panel>
          ) : null}
        </Chart>
      </div>
    </div>
  );
}
Give the chart a real height
The chart fills its container, so the container needs measurable dimensions. In a dashboard, a fixed or responsive height is usually the most predictable option.
.chart-frame {
  height: 600px;
  min-height: 420px;
  overflow: hidden;
}

.chart-loading {
  display: grid;
  height: 600px;
  place-items: center;
}

@media (max-width: 820px) {
  .chart-frame,
  .chart-loading {
    height: 520px;
  }
}
What to change for real market data
This example uses exampleData so it runs without credentials or API setup. In production, fetch OHLCV data in a Server Component, route handler, or your backend, then pass a serializable DataPoint[] into the client chart. Keep functions, class instances, and non-serializable values out of props that cross the server-client boundary.
That gives the chart a clean boundary: Next.js handles the application shell, while react-candlesticks handles Canvas rendering, panels, layers, legends, crosshairs, zoom, and pan interactions.