This comparison follows two complete Vite, TypeScript, and React examples:
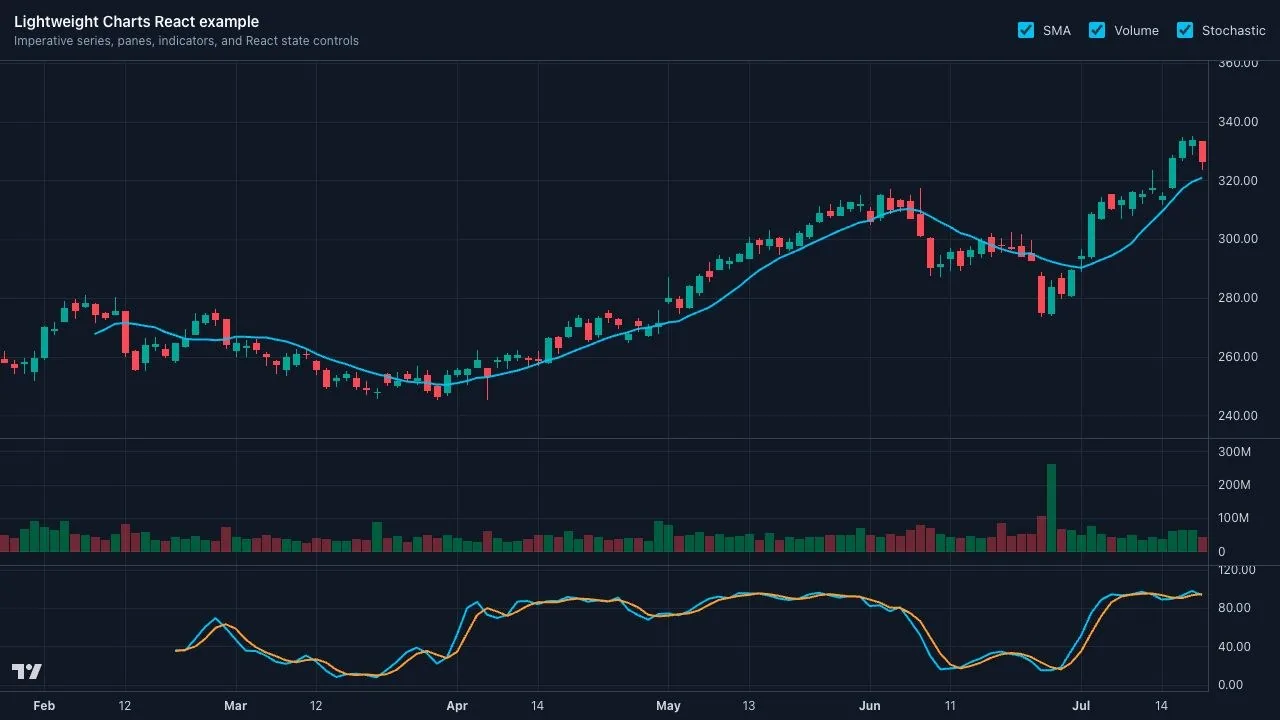
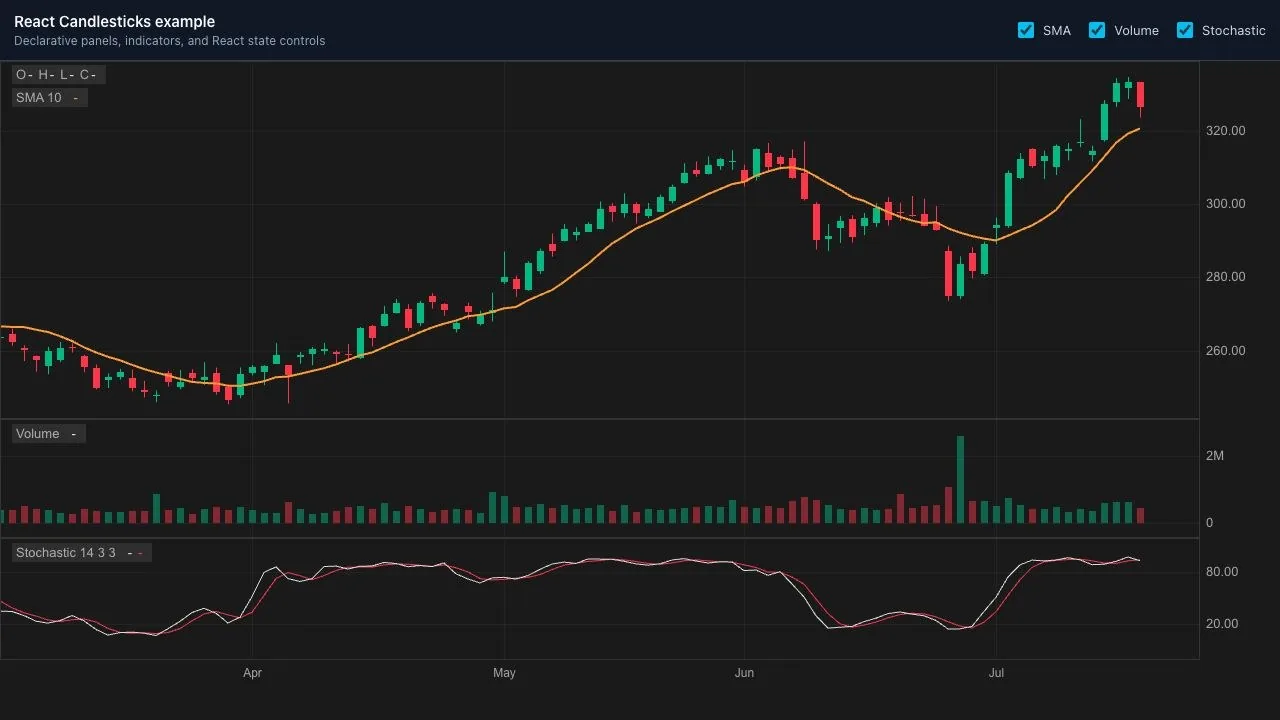
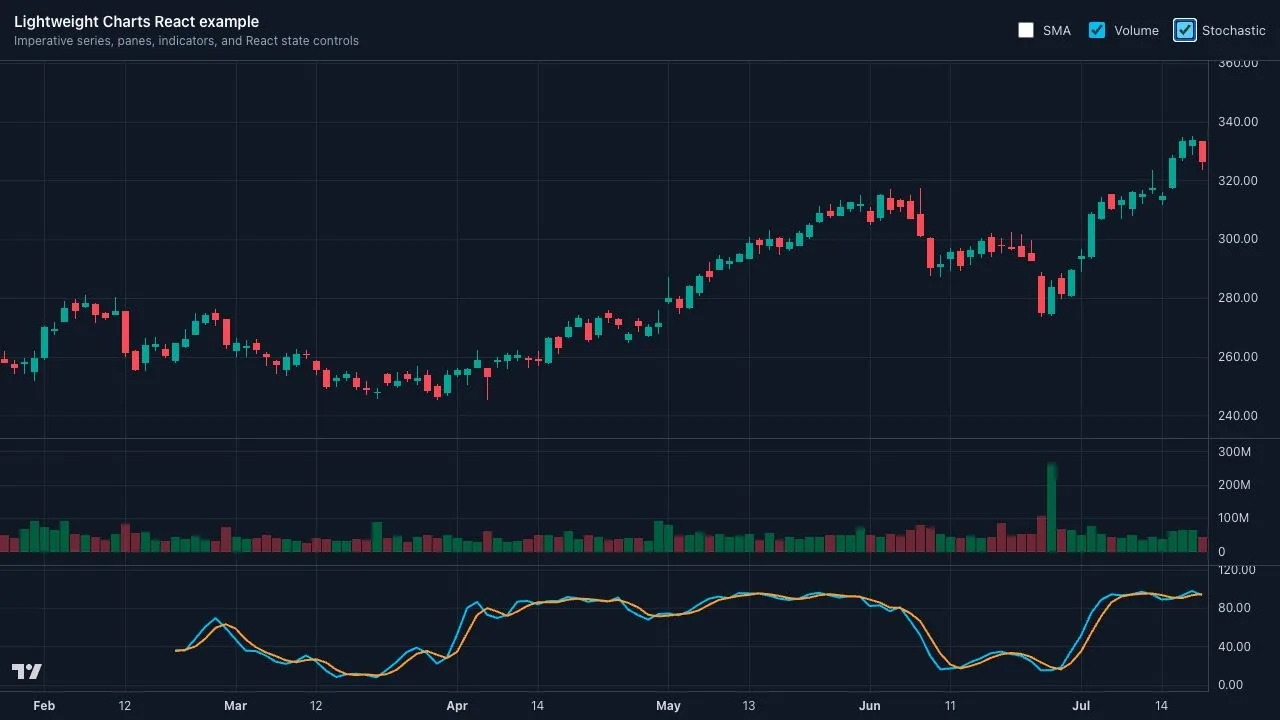
Both examples use the same daily OHLCV data. They render candlesticks, an SMA overlay, a volume pane, a Stochastic pane, and React checkbox controls for toggling those parts of the chart.
The point is not that one library can draw candlesticks and the other cannot. They both can. The useful comparison is how much chart orchestration your React app needs to own.
Quick summary
| Area | Lightweight Charts | React Candlesticks |
|---|---|---|
| API style | Imperative chart API | React component composition |
| React integration | Your component manages chart creation, series, panes, resize handling, and cleanup | The chart structure is declared with JSX |
| Candlesticks | Built in as CandlestickSeries | Built in as <Candlesticks /> |
| Volume | Rendered as a histogram series in a pane | Rendered as <VolumeBars /> inside a <Panel> |
| Indicators | Values are passed to chart series | Common indicators are rendered as chart components |
| Panel sizing | Managed through pane APIs such as setStretchFactor | Managed through <Panel> layout props |
| Controls | React state triggers chart updates, chart recreation, or explicit series management | React state controls normal conditional rendering |
| Best fit | Mature standalone chart engine | React trading UIs with composable chart structure |
The most important difference is not rendering capability. Lightweight Charts is a strong charting library. The difference is the boundary between the charting engine and your React application.
The shared example shape
Both demos intentionally show the same product surface:
- daily OHLCV candlestick data
- a 10-period SMA overlay
- a separate volume pane
- a separate Stochastic pane
- checkbox controls for showing and hiding SMA, volume, and Stochastic
The examples are intentionally limited to equivalent chart features. That keeps the comparison focused on candlesticks, volume, indicators, panes, and React controls.
Before comparing: both libraries need your own data
Neither library provides live market data. Your application is still responsible for loading OHLCV data from a market data source or your own backend.
The demos use a local data.ts file with this shape:
export type OhlcvPoint = {
  time: string;
  open: number;
  high: number;
  low: number;
  close: number;
  volume: number;
};

export const data: OhlcvPoint[] = [
  // Daily OHLCV data.
];
Lightweight Charts expects date strings for daily time values, so the example maps ISO timestamps with point.time.slice(0, 10). React Candlesticks receives the same original data and a chart granularity of d1.
The main difference: chart engine vs React chart components
With Lightweight Charts, your React component creates a chart instance and adds series to it:
const chart = createChart(containerRef.current, {
  width: containerRef.current.clientWidth,
  height: containerRef.current.clientHeight,
});

const candles = chart.addSeries(CandlestickSeries, {
  priceLineVisible: false,
  lastValueVisible: false,
});

candles.setData(
  data.map((point) => ({
    time: point.time.slice(0, 10) as Time,
    open: point.open,
    high: point.high,
    low: point.low,
    close: point.close,
  })),
);
That model is powerful and flexible. It also means your component owns the chart lifecycle: create the chart, add the series, map the data, resize the chart, set pane layout, and remove the chart when the component unmounts.
With React Candlesticks, the equivalent candlestick chart is expressed as JSX:
<Chart data={data} granularity="d1" theme="dark" initialScrollToLatest>
  <Panel heightRatio={3}>
    <Candlesticks />
  </Panel>
</Chart>
The React tree describes the chart. If a layer is rendered, it appears. If a layer is removed from the JSX, it disappears.
A note on indicators in Lightweight Charts
Lightweight Charts is primarily a chart rendering library. Indicator values are usually calculated outside the chart and then passed to a series.
That is not a weakness of Lightweight Charts. It is part of the design. Your app can calculate indicators itself, receive pre-calculated indicator data from an API, or use whatever calculation approach fits the product.
In this comparison, the Lightweight Charts example calculates SMA and Stochastic values in local helper functions. React Candlesticks exposes common indicators as chart components, so layers such as <SMA /> and <Stochastic /> can be added directly to the chart.
Install each example
The Lightweight Charts example installs the charting engine directly:
npm install lightweight-chartsThe React Candlesticks example installs the React chart component library:
npm install react-candlesticksReact Candlesticks also imports its stylesheet once from the app entry point:
import 'react-candlesticks/style.css';The rest of the article uses snippets from the two example repos rather than showing every line of each app. The full source is available in the linked GitHub examples.
Add candlesticks
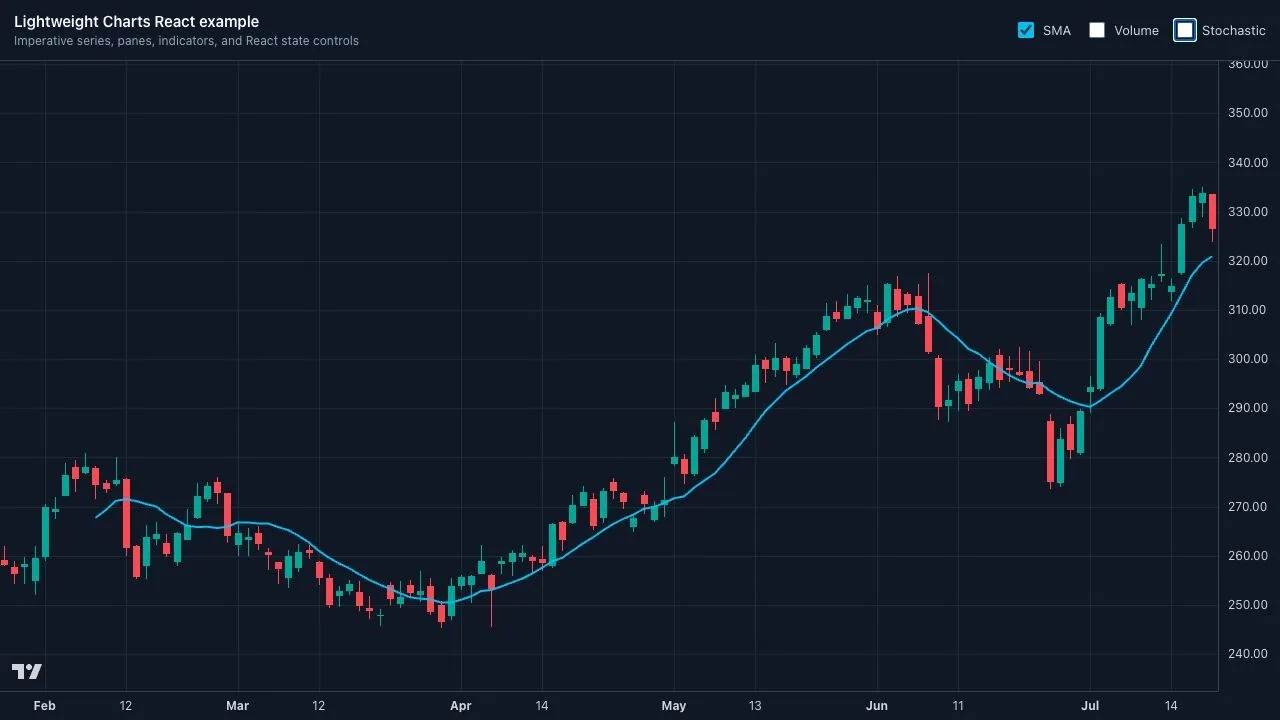
The Lightweight Charts version creates a candlestick series, maps the data into the shape expected by the library, and then calls setData:
const candles = chart.addSeries(CandlestickSeries, {
  priceLineVisible: false,
  lastValueVisible: false,
});

candles.setData(
  data.map((point) => ({
    time: point.time.slice(0, 10) as Time,
    open: point.open,
    high: point.high,
    low: point.low,
    close: point.close,
  })),
);
The React Candlesticks version declares a chart and a panel, then renders <Candlesticks /> inside it:
<Chart data={data} granularity="d1" theme="dark" initialScrollToLatest>
  <Panel heightRatio={3}>
    <Candlesticks />
  </Panel>
</Chart>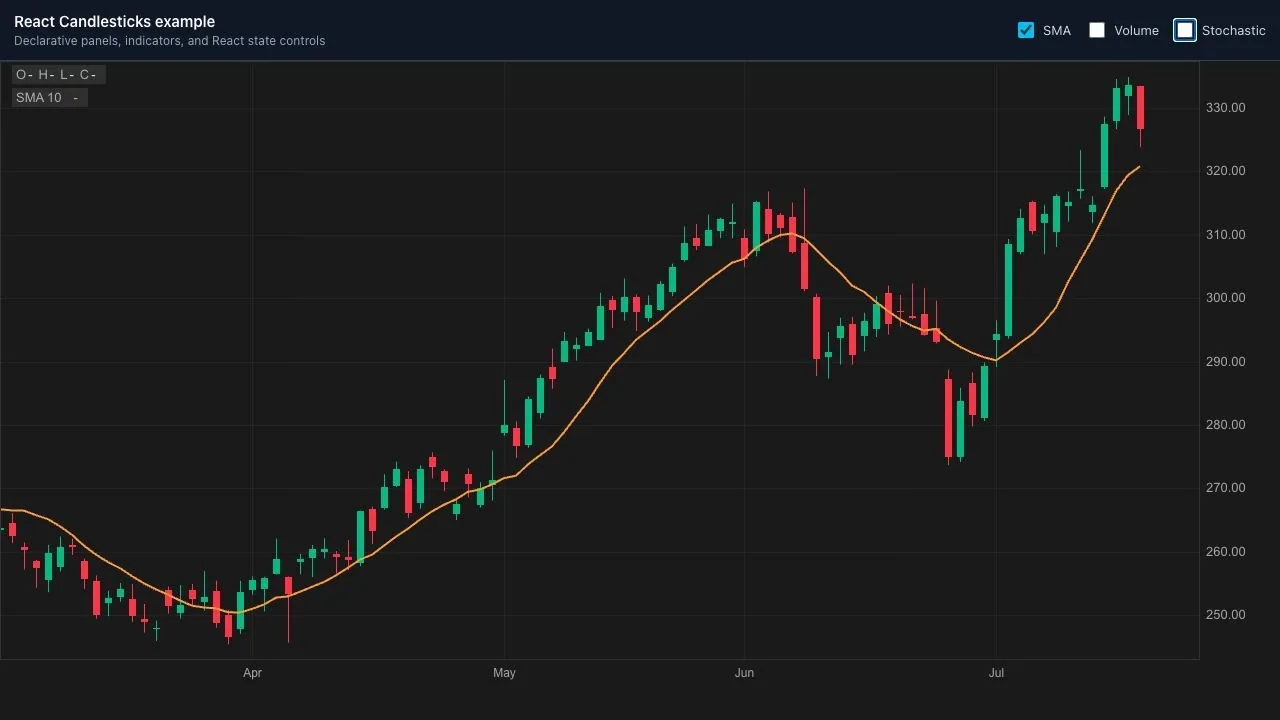
Add an SMA overlay
In the Lightweight Charts example, SMA values are prepared before they are passed to the chart:
if (showSma) {
  const sma = chart.addSeries(LineSeries, {
    color: '#38bdf8',
    lineWidth: 2,
    priceLineVisible: false,
    lastValueVisible: false,
  });

  sma.setData(toLineSeriesData(calculateSma(data, 10)));
}
The SMA values could come from local helper code, but they could also come from your backend or market data layer. Lightweight Charts does not need to know where they came from. It only needs the series data.
With React Candlesticks, SMA is an indicator component in the price panel:
{showSma ? (
  <SMA
    period={10}
    series={{
      value: {
        color: '#f59e0b',
        width: 2,
      },
    }}
  />
) : null}
If you want full control over an indicator formula, the Lightweight Charts approach is direct. If you want common indicators to behave like chart components, the React Candlesticks version keeps that inside the chart API.
React Candlesticks also has several styling levels: the chart theme, chart-level props, and layer-level props. For many cases, a theme is enough. For more specific cases, individual layers can be styled directly.
Add volume and Stochastic panels
Volume is rendered as a histogram series in the Lightweight Charts example. It is placed in pane 1, after the main price pane:
const volume = chart.addSeries(
  HistogramSeries,
  {
    priceFormat: { type: 'volume' },
    priceLineVisible: false,
    lastValueVisible: false,
  },
  1,
);

volume.setData(
  data.map((point) => ({
    time: point.time.slice(0, 10) as Time,
    value: point.volume,
    color: point.close >= point.open ? '#22c55e66' : '#ef444466',
  })),
);
Stochastic is rendered as two line series. If volume is visible, Stochastic goes in pane 2; otherwise it goes in pane 1:
const paneIndex = showVolume ? 2 : 1;
const stochastic = calculateStochastic(data, 14, 3, 3);

const kLine = chart.addSeries(
  LineSeries,
  {
    color: '#38bdf8',
    lineWidth: 2,
    priceLineVisible: false,
    lastValueVisible: false,
  },
  paneIndex,
);

const dLine = chart.addSeries(
  LineSeries,
  {
    color: '#f59e0b',
    lineWidth: 2,
    priceLineVisible: false,
    lastValueVisible: false,
  },
  paneIndex,
);

kLine.setData(toStochasticLineData(stochastic, 'k'));
dLine.setData(toStochasticLineData(stochastic, 'd'));
The Lightweight Charts example also sets pane stretch factors so volume and Stochastic occupy the same amount of vertical space:
const mainStretch = showVolume && showStochastic ? 0.6 : 0.8;
const volumeStretch = 0.2;
const stochasticStretch = 0.2;

panes[0]?.setStretchFactor(mainStretch);

if (showVolume) {
  panes[paneIndex]?.setStretchFactor(volumeStretch);
  paneIndex += 1;
}

if (showStochastic) {
  panes[paneIndex]?.setStretchFactor(stochasticStretch);
}
In React Candlesticks, both lower panels are JSX:
{showVolume ? (
  <Panel>
    <VolumeBars />
  </Panel>
) : null}

{showStochastic ? (
  <Panel>
    <Stochastic kPeriod={14} />
  </Panel>
) : null}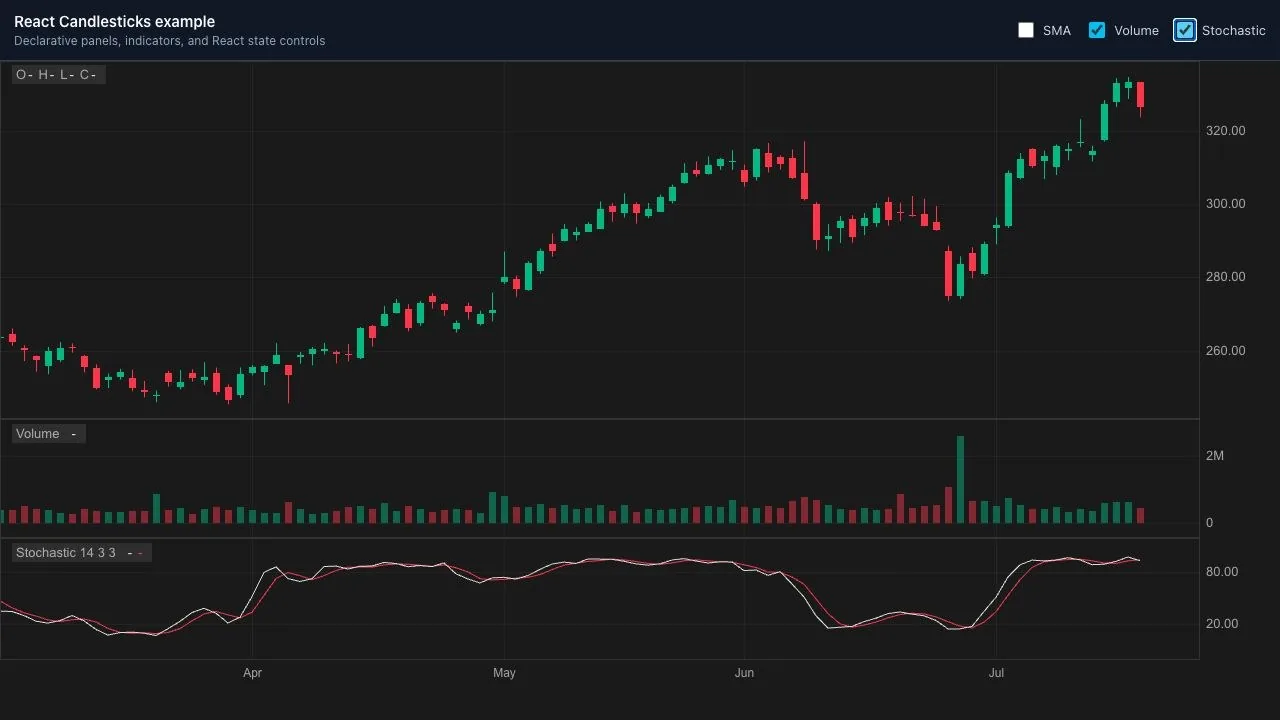
The practical difference is where the chart orchestration lives. In Lightweight Charts, the example coordinates pane indexes, series setup, indicator data, and pane sizing. In React Candlesticks, panels and layers are declared in the render tree.
Add React controls
Both examples use the same React state for controls:
const [showSma, setShowSma] = useState(true);
const [showVolume, setShowVolume] = useState(true);
const [showStochastic, setShowStochastic] = useState(true);
In the Lightweight Charts example, state changes cause the effect to rebuild the chart with the selected series and panes:
useEffect(() => {
  // Create chart, add the selected series, apply pane layout,
  // observe resizes, then remove the chart during cleanup.
}, [showSma, showStochastic, showVolume]);
That is a simple and readable approach for a comparison demo. In a larger production app, you might keep references to chart series and update them more surgically instead of recreating the chart. Either way, the React component needs to coordinate the chart instance with the current UI state.
In the React Candlesticks example, state changes are normal conditional rendering:
{showSma ? <SMA period={10} /> : null}
{showVolume ? <Panel><VolumeBars /></Panel> : null}
{showStochastic ? <Panel><Stochastic kPeriod={14} /></Panel> : null}
For a small example, both approaches are manageable. The difference becomes more noticeable as you add more optional overlays, panels, settings, and layout rules.
Where Lightweight Charts Is the Better Choice
Choose Lightweight Charts if you want a mature standalone financial charting engine and you are happy to build the React integration around it.
It is a particularly good fit when:
- you want a widely used open-source charting library
- you are comfortable managing chart instances and series yourself
- you want fine control over data calculation, pane layout, and rendering
- your app has charting needs that do not map neatly to React components
- your team already knows the Lightweight Charts API
- you want to build your own React abstraction on top of the chart engine
Lightweight Charts is also a better comparison point than full TradingView products. This article is about the open-source Lightweight Charts library, not TradingView Advanced Charts or the full TradingView platform.
Where React Candlesticks Is the Better Choice
Choose React Candlesticks if you are building a React trading UI and want the chart to feel like part of the component tree.
It is a good fit when:
- your app is already built around React state and JSX
- you want candlesticks, volume, and indicators as components
- you want multi-panel chart layouts to be declared in JSX
- you want to show and hide panels using normal conditional rendering
- you want built-in indicator components for common cases
- you want theme-level and layer-level styling options in a React chart API
The main reason to choose React Candlesticks is not that Lightweight Charts cannot do these things. It can do many of them. The reason is that React Candlesticks exposes the chart structure in a React-first way.
Conclusion
Lightweight Charts and React Candlesticks solve overlapping problems, but they approach React trading charts from different directions.
Lightweight Charts gives you a mature, performant charting engine. You create a chart, add series, provide indicator values, place panes, and manage updates through the chart API.
React Candlesticks gives you a React candlestick chart library with a composable chart structure. You describe panels and layers in JSX, and you use React state to control what appears on the chart.
If you want the most established standalone charting engine, Lightweight Charts is a strong choice.
If you are looking for a Lightweight Charts alternative for React trading charts, and you want candlesticks, volume, indicators, panels, and controls to fit naturally into a React app, React Candlesticks is worth trying.
npm install react-candlesticksTry the React Candlesticks live demo, view the React Candlesticks comparison repo, compare it with the Lightweight Charts comparison repo, read the getting started guide, or view the library on GitHub.